Sampling and Data Collection
Methods of Quantitative Data Collection
Data collection is the process of gathering information for research purposes. Data collection methods in quantitative research refer to the techniques or tools used to collect data from participants or units in a study. Data are the most important asset for any researcher because they provide the researcher with the knowledge necessary to confirm or refute their research hypothesis. The choice of data collection method will depend on the research question, the study design, the type of data to be collected, and the available resources. There are two main types of data which are primary data and secondary data. These data types and their examples are discussed below.
 Dr. Fehr Asks:
How might your role as a nurse influence how you collect data from patients or colleagues? Consider how your professional values, such as empathy, respect, and advocacy, shape your approach.
Data Sources
Secondary data
Secondary data is data that is already in existence and was collected for other purposes and not for the sole purpose of a researcher’s project. These pre-existing data include data from surveys, administrative records, medical records, or other sources (databases, internet). Examples of these data sources include census data, vital registration (birth and death), registries of notifiable diseases, hospital data and health-related data such as the national health survey data and national drug strategy household survey. While secondary data are population-based, quicker to access, and cheaper to collect than primary data, there are
some drawbacks to this data source. For example, a nurse researcher might use hospital discharge data to study readmission rates for post-surgical patients. Potential disadvantages include accuracy of the data, completeness, and appropriateness of the data, given that the data was collected for an alternative purpose.
Even when data are secondary, nurses must ensure ethical use, particularly when dealing with patient records, administrative data, or data about marginalized communities. Researchers must respect confidentiality, data ownership (especially for Indigenous data), and institutional policies for data sharing.
Dr. Fehr Reflection, Ethics in Action:
When using secondary hospital data, how can you ensure confidentiality and respectful use? Think about privacy legislation, organizational policies, and Indigenous data sovereignty principles
Primary data
Primary data is collected directly from the study participants and used expressly for research purposes. The data collected is specifically targeted at the research question, hypothesis and aims. Examples of primary data include observations and surveys (questionnaires).
Observations: In quantitative research, observations entail systematically watching and recording the events or behaviours of interest. Observations can be used to collect information on variables that may be difficult to quantify through self-reported methods. Observations, for example, can be used to obtain clinical measurements involving the use of standardized instruments or tools to measure physical, cognitive, or other variables of interest. Other examples include experimental or laboratory studies that necessitate the collection of physiological data such as blood pressure, heart rate, urine, etc..
When nurses collect observational data, maintaining professional boundaries and minimizing intrusion into patient care settings are essential. Ethical observation means respecting privacy and ensuring that participation is voluntary and informed.
Surveys: While observations are useful data collection methods, surveys are more commonly used data collection methods in healthcare research. Surveys or questionnaires are designed to seek specific information such as knowledge, beliefs, attitudes and behaviour from respondents. Surveys can be employed as a single research tool (as in a cross-sectional survey) or as part of clinical trials or epidemiological studies. They can be administered face-to-face, via telephone, paper-based, computer-based or a combination of the different methods. Surveys are especially useful in nursing research to capture nurses’ perspectives on patient safety, communication, or cultural competency. Figure 8.8 outlines some advantages and disadvantages of questionnaires/surveys.
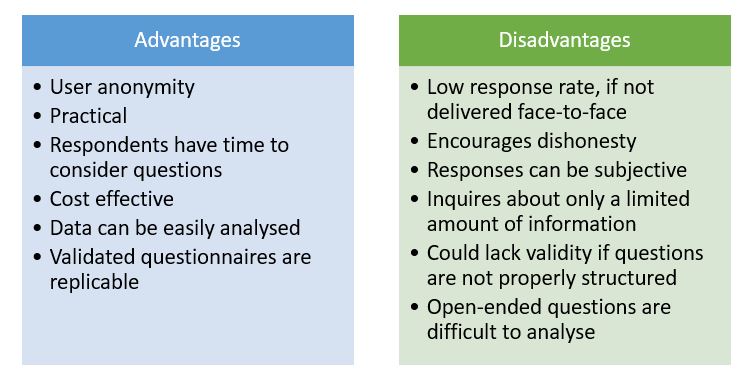
Figure 8.8 Advantages and disadvantages of questionnaires by Bunmi Malau-Aduli and Faith Alele. Adapted from Ackroyd and Hughes 1981 50, used under a CC BY NC 4.0 licence.
Table 8.3: Sampling Summary (Intellectual property of Dr. Florriann Fehr/TRU Open Press CC BY-NC-SA 4.0)
| Concept | Definition | Nursing Example | Ethical Consideration |
| Primary Data | Data collected directly for the study | Survey of nurses’ stress levels | Ensure anonymity and informed consent |
| Secondary Data | Previously collected data used for new research | Hospital discharge data | Respect data privacy and institutional policies |
| Probability Sampling | Every member has an equal chance | Randomly selecting patients for a medication adherence study | Fair representation |
| Non-Probability Sampling | Based on researcher judgment or convenience | Recruiting nurses from one unit | Risk of bias or exclusion |
Designing a survey/questionnaire
A well-designed questionnaire ensures data accuracy and upholds nursing values such as respect, inclusivity, and cultural safety. A questionnaire is a research tool that consists of questions that are designed to collect information and generate statistical data from a specified group of people (target population). There are two main considerations in relation to design principles, and these are (1) content and (2) layout and sequence. In terms of content, it is important to review the literature for related validated survey tools, as this saves time and allows for the comparison of results. Additionally, researchers need to minimize complexity by using simple direct language, including only relevant and accurate questions, with no jargon. Concerning layout and sequence, there should be a logical flow of questions from general and easier to more sensitive ones, and the questionnaire should be as short as possible and NOT overcrowded. The following steps can be used to develop a survey/ questionnaire.
Dr. Fehr Asks:
If you were designing a questionnaire about patient pain experiences, what ethical issues might arise when asking sensitive or trauma-related questions?’ Encourage reflection on trauma-informed approaches in data collection.
Question Formats
Open and closed-ended questions are the two main types of question formats. Open-ended questions allow respondents to express their thoughts without being constrained by the available options. Open-ended questions are chosen if the options are many and the range of answers is unknown.
On the other hand, closed-ended questions provide respondents with alternatives and require that they select one or more options from a list. The question type is favoured if the choices are few and the range of responses is well-known. However, other question formats may be used when assessing things on a continuum, like attitudes and behaviour. These variables can be considered using rating scales like visual analogue scales, adjectival scales and Likert scales. Figure 8.9 presents a visual representation of some question types, including open-ended, closed-ended, likert rating scales, symbols, and visual Analogue Scales.
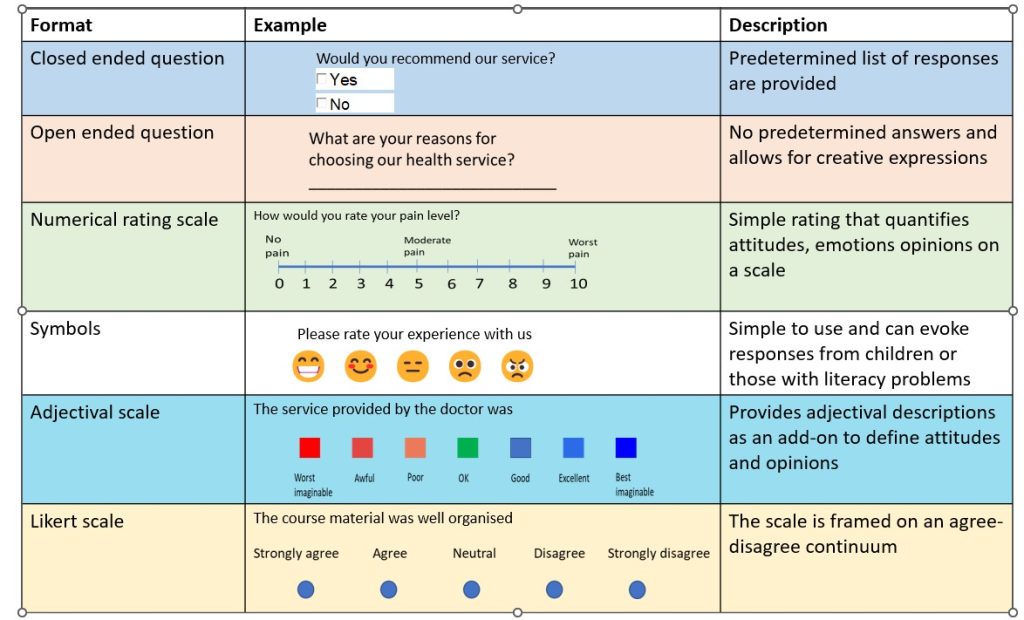
Figure 8.9 Question formats by Bunmi Malau-Aduli and Faith Alele, used under a CC BY NC 4.0 licence
It is important to carefully craft survey questions to ensure that they are clear, unbiased and accurately capture the information researchers seek to gather. Clearly written questions with consistency in wording increase the likelihood of obtaining accurate and reliable data. Poorly crafted questions, on the other hand, may sway respondents to answer in a particular way which can undermine the validity of the survey. The following are some general guidelines for question wording.
Be concise and clear: Ask succinct and precise questions, and do not use ambiguous and vague words. For example, do not ask a patient, “how was your clinic experience? What do you mean by clinic experience? Are you referring to their interactions with the nurses, doctors or physiotherapists?
Instead, consider using a better-phrased question such as “please rate your experience with the doctor during your visit today”.
Avoid double-barreled questions. Some questions may have dual questions, for example: Do you think you should eat less and exercise more?
Instead, ask:
Do you think you should eat less?
Do you think you should exercise more?
Steer clear of questions that involve negatives: Negatively worded questions can be confusing. For example, I find it difficult to fall asleep unless I take sleeping pills.
A better phrase is, “sleeping pills make it easy for me to fall asleep.”
Ask for specific answers. It is better to ask for more precise information. For example, “what is your age in years?________ Is preferable to -Which age category do you belong to?
☐ <18 years
☐ 18 – 25 years
☐ 25 – 35 years
☐ > 35 years
The options above will give more room for errors because the options are not mutually exclusive (there are overlaps) and not exhaustive (there are older age groups above 35 years).
Avoid leading questions. Leading questions reduces objectivity and make respondents answer in a particular way. Questions related to values and beliefs should be neutrally phrased. For example, the question below is worded in a leading way – Conducting research is challenging. Does research training help to prepare you for your research project?
An appropriate alternative: Research training prepares me for my research project.
Strongly agree Agree Disagree Strongly disagree
Sampling Techniques in Quantitative Research
Target Population
The target population includes the people the researcher is interested in conducting the research and generalizing the findings on. For example, if certain researchers are interested in vaccine-preventable diseases in children five years and younger in Australia. The target population will be all children aged 0–5 years residing in Australia. The actual population is a subset of the target population from which the sample is drawn, e.g. children aged 0–5 years living in the capital cities in Australia. The sample is the people chosen for the study from the actual population (Figure 8.10). The sampling process involves choosing people, and it is distinct from the sample. In quantitative research, the sample must accurately reflect the target population, be free from bias in terms of selection, and be large enough to validate or reject the study hypothesis with statistical confidence and minimize random error.
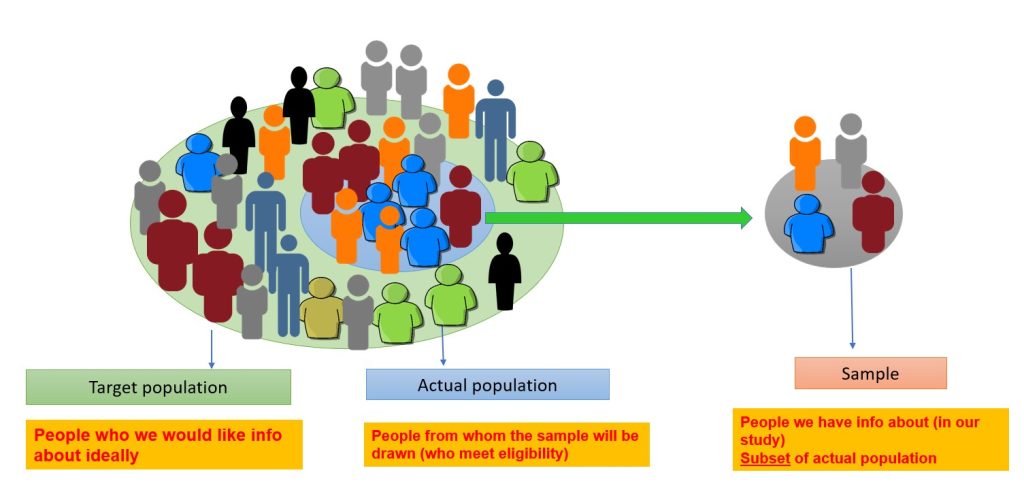
Figure 8.10 The Hierarchy of Populations by Bunmi Malau-Aduli and Faith Alele, used under a CC BY NC 4.0 licence
Sampling Techniques
Sampling in quantitative research is a critical component that involves selecting a representative subset of individuals or cases from a larger population and often employs sampling techniques based on probability theory. The goal of sampling is to obtain a sample that is large enough and representative of the target population. Examples of probability sampling techniques include simple random sampling, stratified random sampling, systematic random sampling and cluster sampling (shown below). The key feature of probability techniques is that they involve randomization. There are two main characteristics of probability sampling. All individuals of a population are accessible to the researcher (theoretically), and there is an equal chance that each person in the population will be chosen to be part of the study sample. While quantitative research often uses sampling techniques based on probability theory, some non-probability techniques may occasionally be utilized in healthcare research. Non-probability sampling methods are commonly used in qualitative research. These include purposive, convenience, theoretical and snowballing.
Do not get overwhelmed with this section—it is not testable but may be helpful if you choose a quantitative research question for your research proposal or future research endeavors!
Sample Size Calculation
In order to enable comparisons with some level of established statistical confidence, quantitative research needs an acceptable sample size. The sample size is the most crucial factor for reliability (reproducibility) in quantitative research. It is important for a study to be powered – the likelihood of identifying a difference if it exists in reality. Small sample-sized studies are more likely to be underpowered, and results from small samples are more likely to be prone to random error. The formula for sample size calculation varies with the study design and the research hypothesis. There are numerous formulae for sample size calculations, but such details are beyond the scope of this book. However, we will introduce a simple formula for calculating sample size for cross-sectional studies with prevalence as the outcome.
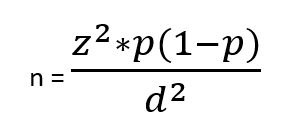
z is the statistical confidence; therefore, z = 1.96 translates to 95% confidence; z = 1.68 translates to 90%
confidence
p= Expected prevalence (of health condition of interest)
d= Describes intended precision; d = 0.1 means that the estimate falls +/-10 percentage points of true prevalence with the considered confidence. (e.g. for a prevalence of 40% (0.4), if d=.1, then the estimate will fall between 30% and 50% (0.3 to 0.5).
Example: A district medical officer seeks to estimate the proportion of children in the district receiving appropriate childhood vaccinations. Assuming a simple random sample of a community is to be selected, how many children must be studied if the resulting estimate is to fall within 10% of the true proportion with 95% confidence? It is expected that approximately 50% of the children receive vaccinations

z= 1.96 (95% confidence)
d= 10% = 10/ 100 = 0.1 (estimate to fall within 10%)
p= 50% = 50/ 100 = 0.5
Now we can enter the values into the formula
Given that people cannot be reported in decimal points, it is important to round up to the nearest whole number.
Activity
Watch the video, Sampling 101 with Skittles [2:40] on YouTube, by Rachel Wilkinson (2017).
 Note: If you are using a printed copy of this resource, watch the video by scanning the QR code with your mobile device.
Best Practices for Optimizing Internet Survey Response Rates
Online surveys are a common and convenient way to collect research data, but achieving high response rates can be challenging. Response rates are influenced by multiple factors, including survey design, delivery method, timing, participant engagement, and follow-up strategies. Here we provide a best practices table, based on a publication in progress, Ms. Michelle Seibel and Florriann Fehr (2026), titled, “Research Choices to Optimize Response Rates in Internet Surveys.” to guide you in planning surveys that maximize participation. These strategies are grounded in research evidence and practical experience, highlighting actionable steps you can take to design surveys that are accessible, engaging, and ethically sound. Think of this as your roadmap to designing surveys that participants are both willing and motivated to complete.
| Stage | Strategy | Example / Tip |
| Development | Make topic relevant & engaging | Choose topics meaningful to participants (e.g., transition stress for new nurses). |
| Personalize communication | Address participants by name; reference prior involvement; send from a recognized researcher email. | |
| Keep survey concise | <10–13 minutes; limit open-ended questions; focus on key measures. | |
| Mobile-friendly design | Use responsive platforms (Qualtrics, SurveyMonkey) for smartphone or tablet completion. | |
| Pre-notify participants | Send advance email: “Survey coming next week… stay tuned!” | |
| Delivery | Use multiple contact methods | Email + phone, email + text, or offer Zoom/paper option. |
| Reminders | Send 2–3 brief, polite reminder emails spaced over days/weeks. | |
| Choose mode strategically | SMS/text for short polls; email for detailed responses. | |
| Completion & Return | Incentives | Prepaid cash, e-gift card, or charity donation; consider attention checks for validity. |
| Reduce cognitive load | Avoid lengthy or complex questions; allow skipping sensitive items. | |
| Maintain longitudinal relationships | Send periodic updates/newsletters; request alternate emails; remind participants of prior involvement. | |
| Ethics & Transparency | Report honestly | Note response rate limitations; describe efforts to maximize participation; do not manipulate data. |
Fig. 8.11 Best Practices Table
Collecting quality survey data requires intentional planning at every stage of the research process. From crafting a relevant and concise survey, to personalizing invitations, to following up strategically and maintaining participant engagement, small decisions can make a big difference in response rates. While low participation is a common challenge, it also provides valuable lessons for improving future research design. By combining evidence-based practices with ethical transparency, researchers can maximize the likelihood of meaningful responses, ensure data integrity, and strengthen the overall quality of their studies. Remember: response rates are not just numbers, they reflect participant engagement, trust, and the effectiveness of your research design.
Dr. Fehr Tip: Reflecting on Response Rates
![]()
Hey students! Quick reality check: even with all the best planning, response rates can be low. That’s okay, it’s part of the research journey.
Here’s the secret: low response isn’t a failure; it’s feedback. Every bounce-back, every unanswered email teaches us something. Maybe the survey was too long, the email went to spam, or participants simply got busy. The lesson? Plan ahead, maintain connection, keep surveys short, personalize every message, and follow up strategically.
And remember, transparency is key. When you report results, own the process. Describe what worked, what didn’t, and what you would do differently next time. That’s how you grow as a researcher. Trust me, even published studies have these lessons tucked away in the limitations section!
Remixed from:
- An Introduction to Research Methods for Undergraduate Health Profession Student by Faith Alele and Bunmi Malau-Aduli (2023) published by pressbooks under a CC BY-NC-SA license.
Media Attributions
- Dr. Fehr [avatar] by Research Assistant Katie Gregson on Canva using Canva AI image creation https://www.canva.com/ai-assistant/ is subject to the Canva Pro Content License.
References
Alele, F., Malau-Aduli, B. (2023). Chapter 3: “Navigating quantitative research.” In An Introduction to Research Methods for Undergraduate Health Profession Students. James Cook University. https://jcu.pressbooks.pub/intro-res-methods-health/part/2-planning-a-research-project/
Wilkinson, R. (2017, September 20). Sampling with skittles. [Video]. YouTube. https://www.youtube.com/watch?t=2&v=CHkEcLvYNM0&embeds_referring_euri=https%3A%2F%2Fadvancing-evidence-based-nursing-research.pressbooks.tru.ca%2F&source_ve_path=OTY3MTQ